Tableau Desktop Specialist 자격증 합격 후기
Tableau Desktop Specialist 태블로 데스크톱 스페셜리스트 자격증이 개편이 되면서 최근 2023년 경향을 반영한 글이 많이 없어 시험 합격하고 후기를 남깁니다.
1. 태블로 자격증 요약 비교
먼저, 태블로에서 제공하는 자격증 중 가장 기초 자격증에 비교적 저렴한 비용, 자격유효 기간이 영구적이고 이론 중심 시험으로 많은 사람들이 데이터 역량 강화를 위해서 Business Intelligence 관련 자격증으로 많이 취득하고 있는 추세입니다.
| 구분 | Tableau Desktop Specialist | Tableau Certified Data Analyst | Tableau Server Certified Associate |
| 목적 | 프로덕트 이해 및 기초 | 데이터 분석 | 태블로 서버 관리자 |
| 난이도 | Associate 기초(최소 3개월 경험) |
Professional 전문(최소 6개월 경험) |
Professional 전문(최소 6개월 경험) |
| 비용(USD) | $100 | $250 | $250 |
| 자격 유효 기간 | 영구 | 2년 | 2년 |
2. Tableau Desktop Specialist 시험 소개
- 시험방식 : 오프라인/온라인( Pearson VUE testing center )
- 문항수 : 45
- 시험 형식 : 객관식, 복수 답변(복수 답변 시 수 지정)
- 제한 시간 : 60분(시험 시작 30분 이전에 체크인해야 함)
- 언어 : 영어, 일본어, 중국어(간체자)
- 합격 점수 : 750점/1000점
- 결과 : 시험 후 24시간 이내에 이메일로 전송
- 응시료 : USD $ 100
- 변경비용 : USD $25
- 시험범위
| 대분류 | 상세내용 | 비중(%) |
| Domain 1: Connecting to and Preparing Data | 1.1 Live connections and extracts 1.1.1 Create a live connection to a data source 1.1.2 Explain the differences between using live connections versus extracts 1.1.3 Create an extract 1.1.4 Save metadata properties in a .TDS 1.1.5 Create a data source that uses multiple connections 1.2 Data model 1.2.1 Add relationships to a data source 1.2.2 Add joins and unions 1.2.3 Explain when to use a join versus a relationship 1.3 Data properties 1.3.1 Rename a data field 1.3.2 Assign an alias to a data value 1.3.3 Assign a geographic role to a data field 1.3.4 Change data type for a data field (number, date, string, Boolean, etc.) 1.3.5 Change default properties for a data field (number format, aggregation, color, date format, etc.) |
23 |
| Domain 2: Exploring and Analyzing Data | 2.1 basic charts 2.1.1 a bar chart 2.1.2 a line chart 2.1.3 a scatterplot 2.1.4 a map using geographic data 2.1.5 a combined axis chart 2.1.6 a dual axis chart 2.1.7 a stacked bar 2.1.8 a density map 2.1.9 a chart to show specific values (crosstab, highlight table) 2.2 Organize data and apply filters 2.2.1 Create groups by using marks, headers, and the data pane 2.2.2 Create sets by using marks and the data pane 2.2.3 Organize dimensions into a hierarchy 2.2.4 Add a filter to a view 2.2.5 Add a date filter 2.3 Apply analytics 2.3.1 Add a manual or a computed sort 2.3.2 Add a reference line 2.3.3 Use a quick table calculation 2.3.4 Use bins and histograms 2.3.5 Create a calculated field (e.g. string, date, simple arithmetic) 2.3.6 Explain when to use a parameter 2.3.7 Display totals on a worksheet |
37 |
| Domain 3: Sharing Insights | 3.1 Presentation 3.1.1 Use color from the marks card 3.1.2 Configure fonts 3.1.3 Format marks as shapes 3.1.4 Configure viz animations 3.1.5 Change size of marks 3.1.6 Show and hide legends 3.2 Dashboard 3.2.1 Add worksheets to a dashboard 3.2.2 Add interactive elements for consumers (e.g. show filters, data highlighter, tooltips) 3.2.3 Add dashboard actions (e.g. filter action, highlight action, parameter control, URL action) 3.2.4 Configure a dashboard layout and create device-specific dashboards 3.2.5 Create a story and a story point 3.3 Workbook data 3.3.1 Share a workbook (e.g. twbx as a PDF or an image, publish to Tableau Server) 3.3.2 View and export underlying data 3.3.3 Export to Microsoft PowerPoint |
25 |
Domain 4: Understanding Tableau Concepts |
4.1 Dimensions and Measures 4.1.1 Explain what kind of information dimensions usually contain 4.1.2 Explain what kind of information measures usually contain 4.1.3 Explain the difference between dimensions and measures 4.2 Discrete and Continuous fields 4.2.1 Explain how discrete fields are displayed 4.2.2 Explain how continuous fields are displayed 4.2.3 Explain the difference between discrete date parts and continuous date values 4.3 Aggregations 4.3.1 Explain the default aggregation for measures 4.3.2 Describe how an aggregated measure changes when dimensions are added to a view |
15 |
3. 2022 개편되기 전과 차이점
| 개편 전 | 개편 후 | |
| 문제 유형 | 이론, 실습 | 이론 |
| 문제 수 | 30 | 45(40 Scored) |
| 오픈북 여부 | 가능 | 불가 |
이전에는 온라인으로 이론과 실습으로 30문제 푸는 방식으로 오픈북 및 온라인으로 검색이 가능하였으나 현재는 불가능합니다. 시험 보기 전에 OnVUE 프로그램을 설치하고 온라인 access 되는지 시험 환경 사진, 비디오로 체크하고 있습니다.
특이하게 개편 후 문제 총 45개 중 5개는 점수에 포함되지 않으며 어떤 문제인지도 표시되지도 않습니다.
4. 시험
4.1 시험 신청 전 Pearson Vue 가입 시 주의사항
시험 신청전에 태블로 회원가입된 이름을 반드시 여권에 나온 이름과 동일하게 영문명으로 변경해줘야 합니다. 한글로 적힌 경우 Pearson 넘어갈 때 등록된 이름이 single-byte으로 되어 있지 않으면 에러가 발생하여 신청 자체가 불가하고 이름 같은 경우에는 개인이 변경하지 못하기 때문에 따로 신청해서 변경해야 합니다. 이 같은 경우 메일로 보내면 영업일 기준 2~3일 정도 소요됩니다.
4.2 시험 예약, 결제
시험 신청을 위한 필수 선행 요건 없습니다. 다만 Tableau에서는 기본적인 기술과 이해가 있고, 최소 3개월의 제품 사용 경험이 있는 사람으로 명시하고 있습니다.
4.3 시험
시험 전 날
시험 전날 이전까지는 OnVUE 프로그램을 미리 설치하고 시험환경을 미리 테스트해봐야 합니다. OnVUE 프로그램을 실행하여 네트워크 속도 및 환경 세팅을 사전에 확인해야 합니다. 가리고 시험 당일날 면접관과 소통할 수 있도록 마이크, 웹캠, 오디오 권한 설정 및 이상이 없는지 체크를 합니다.
저는 집에서 노트북으로 진행하였고 책상 위에 아무것도 없어야 합니다.
시험 당일
준비물: 입실 인증을 위한 휴대폰, 깨끗한 책상, 웹캠이 있는 노트북, ID(여권)
입실하는 당일에는 시험 30분 전부터 입장 가능합니다. 다만, 시험 환경(앞,뒤,좌,우) , 응시자, 신분증을 휴대폰으로 촬영해야 입장이 되기 때문에 은근히 소요시간이 길어서 미리 입장 하시는 것을 추천드립니다.
이메일 내에 삽입된 링크를 통해서 입장하고 온라인 입실 시에 휴대폰으로 입실을 하여 휴대폰으로 QR로 웹사이트로 이동하여 시험환경 앞, 뒤, 양옆과 응시자 얼굴과 응시자 ID를 촬영합니다. 업로드를 마치고 나서 다시 노트북으로 응시 프로세스 종료를 하고 휴대폰은 멀리 둡니다.
사진 촬영이 끝나고 면접관과 1:1 영상으로 환경 체크를 다시 합니다. 노트북 캠으로 시험환경 비추라고 합니다. 인도인으로 추정되는 감독관이 주변 환경을 노트북 웹캠을 통해서 비춰달라 요청하였 고이 전에 가이드 읽고 책상에 다 치웠어서 따로 요구 사항 없이 넘어갔습니다. 이 프로세스 끝나면 시험이 바로 시작됩니다.
시험 문제
시험문제는 생각보다 개편 전과 비교해서 크게 변하지 않았다고 느꼈습니다. 태블로 제품에 관한 문제이다 보니 ~하는 방법 관한 문제가 너무 많이 나와 미리 정리해 두는 것을 추천드립니다.
그리고 복수 답변의 경우 몇개 선택하라고 명시되어 있어 큰 걱정은 안 하셔도 됩니다.
시험 보면서 나왔던 유형
- dashboard/worksheet/row/column 레벨로 폰트 설정하는 방법
- 그룹화 방법 중 visually grouping 방법
- visual grouping 하는 경우 대시보드 화면 변화
- Continuous, Discrete Pills 구분
- TDS 구성 내용
시험 후
온라인 자격증은 시험이 끝난후 24시간 이내 출력 가능합니다. Credly 배지는 바로 사용 가능합니다.
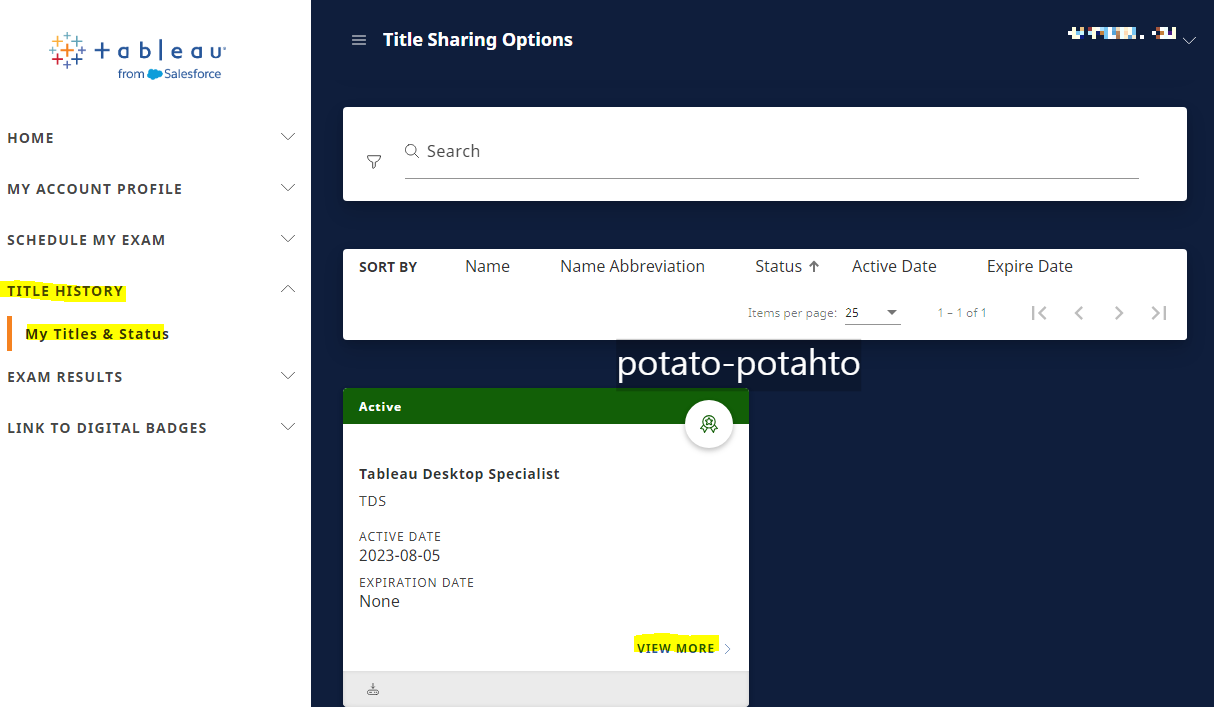
태블로 certification 출력하는 화면을 찾기 어려워서 여기에 정리해 드리면..
1. 첫 이미지와 같이 cp.certmetrics.com/tableau 메인 화면의 메뉴에서 Title History > My Titles & Status 이동 후 최하단으로 스크롤 다운하시면 View More을 클릭
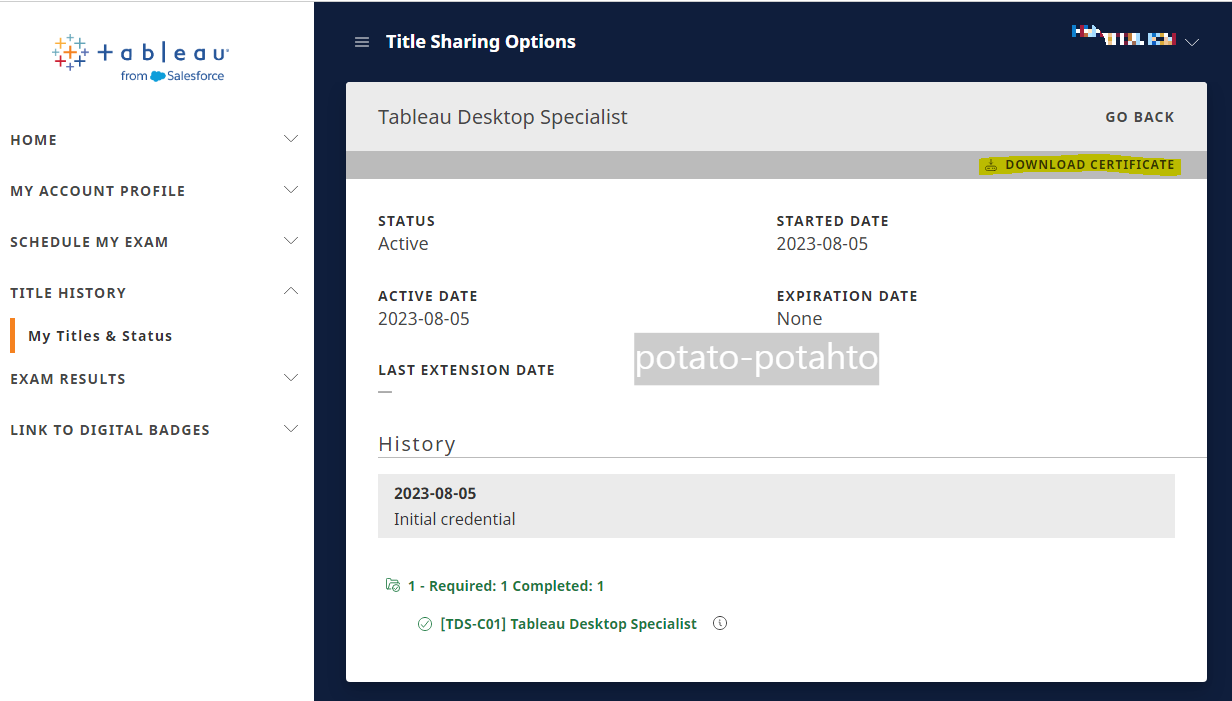
2. 두번째 이미지와 같은 화면이 나오고 우측 상단에 Download Certificate을 클릭
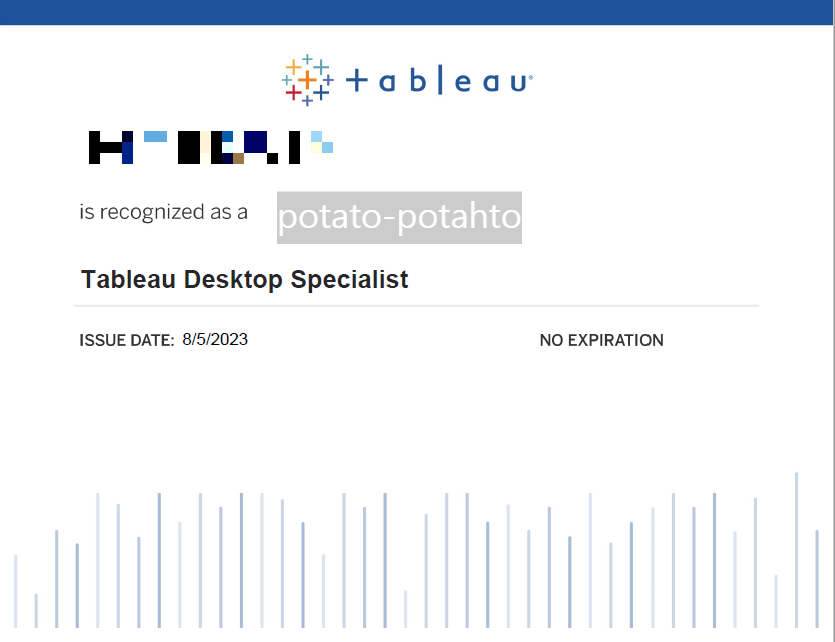
3. 마지막 이미지와 같이 PDF 포맷의 이미지가 자동 다운로드 됨
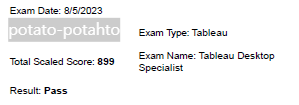
5. 취득 방법
899점으로 취득하였습니다.
태블로 신병 훈련소, 태블로 UDT 무료 교육 모두 수료하면서 이론 관련해서 블로그에 정리한 경험과 실무에서 Tableau 대시보드 생성 및 운영 경험이 있습니다. 그렇다고 업무가 BI tool을 활용하는 쪽이라서 프로덕트에 대한 이해가 필요한 상태였습니다.
5.1 학습방법
이전에 사용한 경험이 있다면 소요한 시간정도로 잡으면 되고 그렇지 않다면 좀 더 길게 잡아야 합니다. 제 기준으로는 시험 전 주말 제외하고 2주 이내로 매일 하루 평균 3시간 내외로 강의 듣고 모의고사 풀고 정리하면서 공부하였습니다.
5.2 리소스
Udemy에 2만 원 이하로 강의를 수강할 수 있어 추천드립니다. 대부분 강의는 영어로 제공되며 한국어로 되어 있는 경우 10배 이상 비쌌습니다. 최근에 웅진 싱크빅을 통해서 한글로도 제공하는 강의도 있었습니다.
추천하는 Udemy 강의는 Tableau Desktop Specialist Certification Exam Prep 2023 & PracticeTests 며 2개다 수강하는 것을 추천드립니다. 특히 오른쪽의 모의고사가 실제 문제와 가장 유사한 내용이 많이 나왔습니다. 다만, 강의 내용은 완전 최신이 아니라는 단점이 있지만 프로덕트 자체에 큰 변화가 없기 때문에 큰 문제없었습니다.

제 경우에는 시간이 부족해서 위의 두 강의로 커버했으나 위의 강의와 모의고사로 커버하는데 한계가 있어 시간이 되신다면 태블로에서 추천하는 리소스도 확인하면 고득점 가능합니다.
- Free How-To Training Videos
- Tableau Product Support
- Tableau Product Help
- Visual Analysis Best Practices Guidebook
5.3 팁
1. 강의 & 모의고사 정리하기
시중에 떠도는 모의고사의 문제 형식이 유사하다. 패러프레이징되어 나오니 모의고사의 영단어를 외우지 말고 뜻을 알고 가는 것을 추천
2. 특히 태블로 프로덕트 설정 방법 정리하기
폰트 설정에도 전체 적용, 특정 axis 적용 등으로 여러 방법을 모두 정리하는 것이 좋다.
3. 태블로 만의 기본적인 개념 및 이론 확립하기(예. Context Filter, Pills, Blending)
태블로 help에서도 중점적으로 다뤄지는 data modeling, pills , order of opertions 등 주요 개념 필수 정리
4. 태블로 공식 사이트 help에서 개념 추가 정리하기(optional)
시간이 넉넉하다면 추천드리는 방법.
5. mark for review활용하기
시험을 치면서 추후 리뷰가 더 필요한 경우 review 할 수 있도록 체크 버튼이 있습니다. 체크된 문제의 경우 한 번에 이동할 수 있어 헷갈리는 부분 표시해 두었다가 상충되는 부분 있는 경우 확인하여 활용했습니다.
5.4 후기
Tableau Desktop Specialist 자격증을 준비하면서 느낀 점은 Tableau Desktop 프로덕트 사용법에 대해 중점적으로 나오기 때문에 Tableau를 BI툴로 사용하는 회사 지원 시에 기본기나 관심을 어필하기에 좋아 보였습니다. 또, 현직자 중에서도 Tableau의 핵심 기능들을 폭넓게 알기에도 좋았습니다. 실제로 취득하면서 기본적인 기능만 익혔는데 해당 이론에서 배웠던 logical table을 Blending 사용해서 쿼리 퍼포먼스 향상 및 worksheet level에 맞춰 설정 변경도 해보게 되었습니다.
1장 기본
1. 태블로 화면 구성
| Data Pane Table Dimension/Measure |
Analytics pane | Marks Card |
column shelf, row shelf view |
|
2.Repository
태블로 다운로드 시 Document repository 에 자동으로 생성
기본 레포지토리 : Document /My Tableau Repository/ all supporting files
- Data Sources - 다양한 데이터 파일 저장
- hyper(default)/TDS
- Postgre SQL (SQL) , Amazon Redshift(cloud), SAP HANA, Google BigQuery
- logs/crashdumps
- workbooks twb workbook , twbx tableau package book
- shapes arrows, bars, weather internal png images - able to load own image
방법 : File menu >repository & location > new location
3.Types of Data
3.1Field(column)
- field
- role :discrete dimension, continuous measure( dependent variables )
- data type : 아이콘 모양 기억하기

3.2 Data Source page
one single view
- Metadata: type, name
- preview of data (100 rows) : number of fields and rows
- setting

3.3 Discrete pill & Continuous pill
| Data Role | Result |
| continuous pill | axis |
| discrete pill | headers/labels |
| Measure | header + axis |
| dimension | header |
4.Auto generated Field
- measure name, measure values 삭제 불가
| auto-generated fields | list |
| 1 dimension | Measure Nams: contains all name of measures |
| 4 measures | latitude, Longitude, number of records, Measure Values |
Group by Folders Dimension | Measures
5. Properties
default properties
- color
- number format : M, $prefix
- aggregation
- total using
- comment-다른사람과 공유시 코멘트 공유
- sort
- shape
2장 Connecting to and Preparing Data
2.1 Live vs Extracts
| Live (default) | Extracts : subset of original data source |
|
|
2.2 Tableau File Types and Folders
2.3 Save Datasource
| Tableau Data Extract | Tableau Data Source | Package Data source | 통합문서 | 패키지통합문서 | bookmark | |
| data | o | x | o | x | o+@ | x |
| viz | x | x | x | o | o | 1 wrksht |
| 특징 | extract/subset | info to connect | query | viz | viz | viz |
| 확장명 | tdx | tds | tdsx | twb | twbx | tbm |
- Extract (.hyper or .tde-tableau data extract) – To create a local copy of a subset or entire data set that you can use to share data with others, when you need to work offline, and improve performances
- .tds (Tableau Data Source)
- only the information needed to connect to the data source
- not the actual data itself
- modifications (rename, calculated fields,groups)
- Package Data source tdsx extensions
- all info in data source and copy of any local file-based data
- .twb Workbooks –multiple worksheets, dashboards ,stories.
-, but no copy of the data - .twbx ( Tableau packaged workbook)
- all supporting local files > data access :)
- local file data source (copy)
- viz, info to build biz
- background images
- twbx file extension (worksheets,dashboards, data source)
2.3 Tableau Data Model
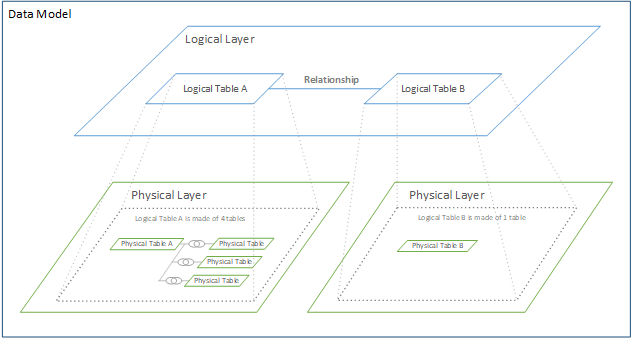
- every data source that’s queried in Tableau
- each logical table has at least 1 physical table(1:n) L:P = 1:N
- a diagram tells T how tables are connected and how it should query them properly
- 2 layers


| 구분 | LOGICAL LAYER | PHYSICAL LAYER |
| 위치 | Relationships canvas | Join/Union canvas |
| 테이블 | logical tables -relate | physical tables - join |
| role | containers for physical tables | double click logical to check |
| LOD | row level of logical tables agg lvl for viz |
row level of merged tables |
| merge | distinct (normalized) |
into a single data source |
| 특성 | auto-created, dynamic | static, fixed |
| not matched | not dropped | dropped(exclude) |
| issues | 중복 미허용 | duplication, filtering issues |
| query | relevant to current view | every query |
2.4 Difference from Relationships and joins
1)Creating Joins
Join - a collection of tables combining on based on common fields
join type, field 선택
- max number of join : 32 tables
- resulted in a new single table
- not able to query original table individually
- automatically choose appropriate join at run-time based on what fields you’ve dragged into the view
- Inner(default) - intersection
- Left - all from left -> match, match 없는 경우 null *조인 순서 중요함
- Right
- Full outer -
- Union
방법
- double click logical tables > join/union canvas in phy layers
- click logical tables > go to join/union canvas
2) Relationships
- dynamic way of combining data from multiple tables for analysis
- no join but defines relationship to each other
- remain distinct
- maintain own LOD
- more powerful than join- recommended
- field - data type 동일해야함
- Geo, Circular X-+
- 자동 연결
- matching field & key constraints
- 없는 경우 m:n
4)Union
- append values (rows) from one table
- column names and number should be same
- tables must come from same connection
- 겹치든 상관 없음
- 이름이 상이하면 상이한 필드 각각 생기지만 null 도 생김
방법
- manual - specific tables
- automatic - wildcard Search
5)Blends
- sheet-by-sheet basis
- combine data from multiple data sources(different connections)
- fetching results only
- blended in a visualization -> no publish
- simulates left join 방식 : primary - secondary
Manage Data Properties
- on a per sheet basis
2.5 Renaming Fields
- no change in remote name in original data source
- field name - custom name in tableau(
- remote name - name in orig data source [table].[column]
- Data source -double click field
- Data source - click drop down of field name
- worksheet- right click to rename
- broken field : a change of fields/title in the source data that Tableau won’t understand
- fix : replace the references
2.6 Creating alias
- aliases only for discrete dimensions not continuous dimensions, dates,measures
- categorical variable 의 값(member)에 alias 생성 가능 예. 가구 - 의자 -> 소파
- updated in data source
- labels appear differently in the view.
3장 Exploring and Analyzing Data
3.1 Bar
구성 : 1 measure, 1 dimension(optional)
mark : bar
- swap rows columns -> vertical <-> horizontal
- dragging to text in Marks
- show Mark Labels 클릭
- Sorting
3.2 Bullet graph
- 2 measure on row shelf , detail
3.3 Stacked Bar charts
구성 : 1 measure, 1 dimension, 1 dimension in color on Marks card
3.4 Date Parts and Data Values
- date part : discrete(blue) Year, Quarter, Month, Dat -> Q2
- date value : continuous(green) year Quarter month week number day -> Q2 2023
3.5 Line Charts
- date 사용하면 line chart가 디폴트
- path : linear, step, jump
3.6 Scatter Plots
at least 2 measures in row, column shelf, 1 dimension on Detail(inc LoD)
- color, shape on mark card, line on analytics pane
- cartesian chart with x & y coordinates
analytics pane : forecast, trendline, average/median with 95% CL
3.7 Dual Axis
dual axis - 2 independent axes, separate measures)
1 dimension, 2 measures in the same shelf
- can compare multiple measures - independent axes
- two measures with different scales :)
- mark 카드가 여러개 생성됨
만드는 방법
- 라인 차트 하나 만들고 오른쪽 axis로 drag & drop
- shelf 중 하나 선택해서 dual axis 선택
3.7 combined axis chart/Blended axis chart
Combined Axis - multiple measures or 1 dimension into a single axis)

- Synchronise axis -> combine axis chart
- 라인 차트 하나 만들고 왼쪽 axis로 drag & drop(자동 싱크로나이징)
- 각기 다른 2개의 axis 사용하면 복잡하고 scale로 인해서 착오 발생 방지
3.8 Symbol Maps
- prerequisites: must contain geographic data
- mark - automatic(circle)
- auto-created for geo data
- geographic data 데이터를 캔버스에 drag & drop
- 각 shelf에 longitude, latitude 자동생성됨, geo 데이터 detail on marks card
- map layers : 색상, 라인 배경, 지명
- size, color
3.9 Filled Maps/polygon Maps
- mark - Map, colors
- nothing to adjust on Marks except color,label
- size: Sales, color : profit, State :Shape, Country:Detail
3.10 Tree maps
- Size option on the Marks card not work
- You use dimensions to define the structure of the treemap, and measures to define the size or color of the individual rectangles.
- measure = size ,color
- max in top left, min in bottom right
- ideal for more than 5 dimensions
- no axis
- shape of marks : tree maps , text cloud, bubble cloud
3.11 Pie Chart
- 2~5 categories
3.12 cross tabs/ pivot tabs/ text tables
1 order of pills on the shelf matters
n dimension on shelf , 1 measures on text on Marks cards
방법
- text on mark cards -> 조정 가능
- double click measures
- drag drop on table Abc
sorting- 각 카테고리별 값 정렬
3.13 Adding Totals to the View
- Analytics > Show row/column grant totlas
- drag 하면 해당 값 합 보여줌
- Analytics pane > totals> subtotlas/ grand totlas
3.14 Quick Table Calculation
- computes on the local data in Tableau
- based on what is currently in the visualization
- do not consider any measures or dimensions that are filtered out of the visualization.

- Quick table calculation
- compute using
3.15 Highlight tables and heat maps
- highlight- color
- heat map - size, color, shape -square
- disable - entire workbook, sheet
3.16 Creating groups from data pane
그룹핑방법 3가지
| type | dimension shelf | Labels in a view | Marks in a view |
| method | consolidated group | consolidated group | visually grouping by colour -나머지 other 할당 -geographic 가능 |
| image |
- dimension/ measures in data pane
- click group by folter
- right click > create . >group
- drag & drop relevant filed into the gorup
3.17 Creating Sets
- filtering - in - members in the set ,out
- general
1.1) manual selection from list
1.2)custom value list
- show members in set
- condition : by field 조건, by formula
- top :top/bottom N
- combined sets : set 1 + set 2 to compare members
3.18 Creating Hierarchies
order matters!
예. 국가, 시군구동 -지도에서 유용
Country/Region(Default), State 설정 필요
add a field to more than one hierarchy
3.19 Filter
only filtered values in this particular view
- relevant information only)
continuous
- aggregation
- range of values/ at least = lower limit required/ at most - upper limit required / special(null values)
discrete
- general
- wild cards
- condition
rearrange filtered display
- clicking on the 2 lines on top and drrging filter
order :discret > continuous
Quick FIlter
- single value (list/ dropdown/slider)
- multiple values
- wildcard Match
date filter
- discrete- list
- continuous -range
3.20 Tableau’s order of Operation
각 필터는 서로 대체 불가하고 독립적(명확한 role)
- extract filters
- data source filters
- context filters
- dimension filters
- measure filters
- table calc filters
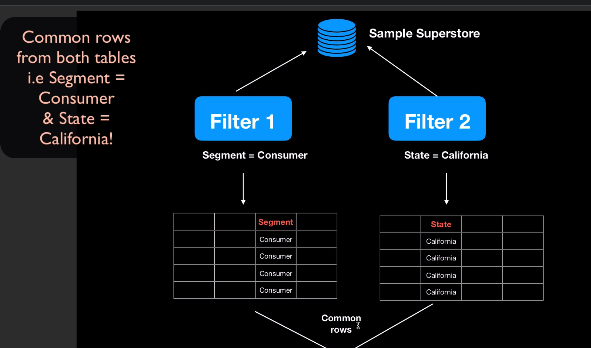
3.21 Context Filters
- include only data of interest (사전에 필터링해서 performance 향상)
- dependent numerical & top n filters
- all filters are computed independently.
- grey color


3.22 Sorting & Manual Sort
- ascending :smaller to bigger
- descending : bigger to smaller
- sortby : data source order in ascending order/ alphabetic/ field/ manual
- manual sort - no matter how the data changes, the values will always stay in the sort order
3.23 Histograms
- 1 continuous measure. continuous/discrete bins(numeric measure/dim)
- distribution of data
3.24 parameter - global placeholder
- data type
- current value
- format
- all/ list/value
- 사용자 입력값 반영할 수 있고 연결해서 사용해야 반영됨(to dynamically adjust to a view)
3.25 calculated fields =#
- creating new column with calculation without change in datasource
- function - blue color
common mistakes
- unique id 기준 : profit ratio = profit / sales 행(on a row-lvl basis)별로 계산하게 되어 잘못된 계산함
- 그룹의 집계 기준: sum(profit)/sum(sales) -on a column basis
3.26 Trend Lines
- analytics pane >model > trend line
- linear, logarithmic, exponential, polynomial, power
- y ,r-squared, p-value
both axes must contain numeric fields (date, int,float)
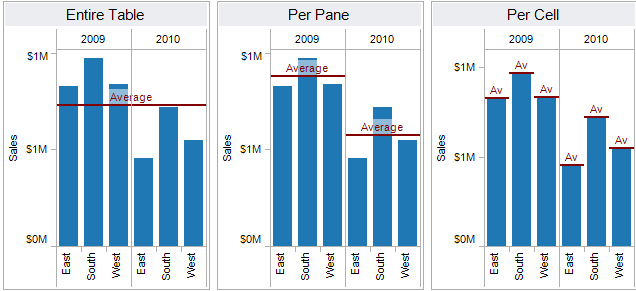
3.27 Reference Lines and Bands
종류
- reference lines - constant/ computed value on continuous axes
- reference bands - shade an area behind the marks between two constant value
- reference distribution
- box plots

적용범위: entire table/ pane/cells
6. Sharing Insights
6.1 Fonts
- font type, size, bold, italic, underline , color , alignment
- theme,title, labels. axes,tootips,sheet,row,columns 조정 가능
설정 방법
- 전체
format menu > dashboard/story/workbook > Format ___ pane
- worksheet level
- format >font > format ___ pane
- sheet - row & column
- row/column - 지정한 페인
- right click row/column/axis/measure > format >설정하기
Tooltip
- worksheet menu>Tooltip>edit Tooltip
- format menu > font/alignment/shade…
- tooltip in Mark cards > right click edit tooltip
Mark Labels
- Analysis > show mark labels
- toolbar(shrtcut) > show mark labels
- Mark > measure 을 Text에 드래그앤 드랍
6.2 Colors
palette 설정 가능
- categorical palette- distinct colour
- discrete -dimension
- no quantitative significance
- quantitative palette
6.3 Viz Animations
- disabled by default
- showing value changes in simpler charts
- unsupported browsers & features
- format > animations > on
- duration : 0.3s (default)
- style :simultaneous/ sequential
- selected sheet/workbook
- animation, duration, style
6.4 Dashboards , layouts
- multiple worksheets
Dashboard pane
- size:

- sheets: 각 시트의 다른 filter, legend 추가됨
- objects:extension, image,web page, text, download, horizontal, vertical , navigation, blank
- padding
layout pane
장점
- faster analysis
- easier to compare
- use one as filter for other sheets
6.5 Dashboards actions
특정 액션에 따라서 다른 시트에도 상호작용가능하도록 함
- Dashboards > actions > highlights/filter/go to url(http,https,ftp),Change set Values
- sheet, parameter
- source/target sheets
- dashboards actions type: hover - highlighting , select - filtering , menu - URL
6.6 Tiled vs Floating
layout내 구성 방법
- tiled : fixed boundary
- floating :overlapping
- layout container - group related dashboard - easy to position
6.7 optimizing layout for different device type
- default - inherent
- auto generated layout
- default ,desktop, tablet , mobile devices
- fit width, fit all
- shorten titles - mobile exp
6.8 Story
story point : 1 sheet in a story
story :a sequence of visualizations that work together
- 1 worksheet or 1 dashboard
- navigate styles = caption box, dots, numbers, arrows only
- highlight updated 됨
7. Share and Export
- export
- static view
- share
- publish to tableau online/ tableau public
- copy
- view copy & paste - data, image(Tagged Image FIle Format TIFF),
방법
- dashboard menu > export/copy image
- worksheets menu > export/copy >image/data
- or right click viz > copy
8.Tableau Server
- create viz, datasource & publish to server
9.Tableau Reader
- static tools to open & interpret with twbx
10.Data Interpreter
- clean & organize data
- selects things like titles, notes, footers, empty cells
11.Data Source from multiple connections
- add a connection> 선택
12.Split a field into Multiple Fields
- string only
- // repeated pattern, separator
- trim(split( [], separator, 위치 ))
- custom split: separator,0 위치
13. Default Settings 변경
# measure right click > Default Properties : comment/color/number format/aggregation/total using
출처
https://www.tableau.com/ko-kr/learn/certification/tableau-desktop-specialist-exam-guide
관련글
[Tableau] 태블로 신병 훈련소(소개,일정,설치, 태블로 퍼블릭 공유)
[Tableau]태블로 UDT(소개,일정,신청,커리큘럼,난이도,무료 교육)
[Tableau]태블로 UDT-1회차 시간의 지배자(유형,날짜 함수,yoy ytd mtd)
[Tableau] 태블로 UDT 2회차 차원의 지배자: 세부 수준 계산식(LoD)
'Data > BI' 카테고리의 다른 글
| [Tableau]Tableau DataFest Korea 2024 현장 스케치와 후기 (0) | 2024.09.23 |
|---|---|
| [Tableau] 태블로 UDT 2회차 차원의 지배자: 세부 수준 계산식(LoD) (0) | 2023.09.04 |
| [Tableau]태블로 UDT-1회차 시간의 지배자(유형,날짜 함수,yoy ytd mtd) (0) | 2023.05.20 |
| [Tableau] 태블로 동적으로 카테고리 별 상위 Top N개/순위 시각화/계산하기 (0) | 2023.04.10 |
| [Tableau] 태블로-두 기간을 동일한 축에 동적으로 시계열 시각화하는 법 (0) | 2023.03.20 |